Food Hygiene
 Health & Safety
 Safeguarding
 First Aid
 Business Skills
 Personal Development
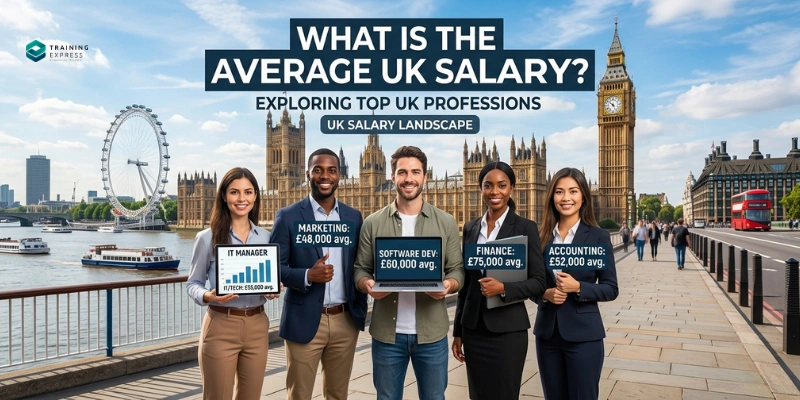

The average UK salary in 2026 is £32,890 a year for all employees, according to the latest Office for National Statistics (ONS) data. If you only count full-time workers, that figure rises to £39,039.
But “average” hides a lot. Your age, where you live, and what you do for work can push your number up or down by tens of thousands of pounds. Below, we’ll break the national figure down so you can see exactly where you stand — and what “average” even means in the first place.
Source: ONS Annual Survey of Hours and Earnings (ASHE), published 23 October 2025.
Table of Contents
Mean vs Median: Which "Average" Are You Looking At?
When people say “average salary,” they usually mean the median — the number right in the middle of everyone’s pay, where half the country earns more and half earns less. It’s the figure the ONS prefers, because a handful of very high earners can’t drag it around.
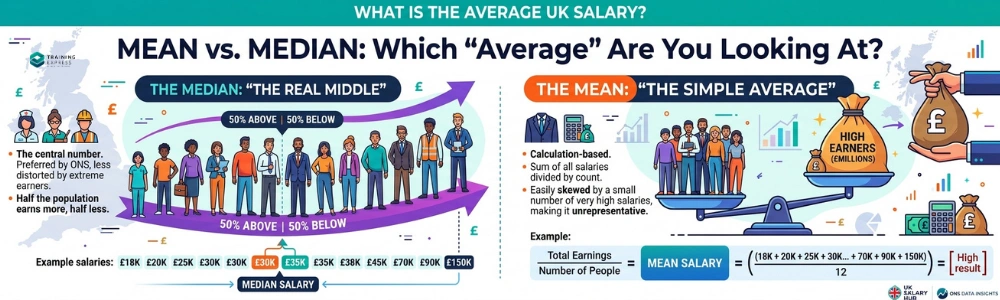
The mean is the “add it all up and divide” average most of us learned in school. It’s higher than the median — £40,269 for all UK employees — because a small number of very high salaries pull it upward.
That’s why you’ll sometimes see two different “average UK salary” headlines. Here’s both side by side:
| Measure | All Employees | Full-Time Employees |
|---|---|---|
| Median | £32,890 | £39,039 |
| Mean | £40,269 | £48,512 |
If you’re comparing your own pay to “the average,” use the median. It’s the more honest picture of what a typical person actually earns.
Average UK Salary by Age
Pay tends to climb through your 20s and 30s, peak in your 40s, then ease off after 50. The highest-earning age bracket is 40–49, at a median of £37,734 a year.
| Age Group | Annual Median | Hourly Median |
|---|---|---|
| 18–21 | £13,069 | £12.59 |
| 22–29 | £29,855 | £15.88 |
| 30–39 | £36,000 | £19.70 |
| 40–49 | £37,734 | £20.65 |
| 50–59 | £34,835 | £19.31 |
| 60+ | £26,750 | £16.45 |
Your 20s: Pay grows fast here as you move out of entry-level roles. By 22–29, the median has already more than doubled from the 18–21 bracket.
Your 30s and 40s: This is typically peak earning territory — promotions, specialisation, and more responsibility all show up in the numbers.
50 and beyond: Median pay dips a little after 50 and drops more after 60. This isn’t necessarily bad news — it often reflects people cutting hours, moving to part-time roles, or retraining as they approach retirement, rather than pay actually falling for people who stay in the same job.
Where do you rank? If you’re 22–29 and earning £37,000 or more, you’re already in the top 30% for your age group. Across most brackets, cracking the top 10% typically means earning well over £50,000 — the exact threshold shifts by age, but the pattern holds throughout your career.
Average UK Salary by Region
Where you work can matter as much as what you do. London has the highest median salary in the UK at £39,778 a year, while the North East has the lowest at £29,584 — a 25% gap.
| Region | Annual Median |
|---|---|
| London | £39,778 |
| South East | £35,215 |
| East of England | £34,104 |
| Scotland | £33,061 |
| South West | £31,432 |
| West Midlands | £31,345 |
| North West | £31,330 |
| Northern Ireland | £31,252 |
| Wales | £30,732 |
| East Midlands | £30,690 |
| Yorkshire and The Humber | £30,682 |
| North East | £29,584 |
Highest and lowest-paying local authorities
Zoom in further and the gaps get even bigger. London commuter towns dominate the top of the list, while coastal and rural areas sit at the bottom.
Top 5 highest-paying local authorities:
| Local Authority | Annual Median |
|---|---|
| Wandsworth | £49,310 |
| Islington | £47,411 |
| Kensington and Chelsea | £46,690 |
| Richmond upon Thames | £46,594 |
| St Albans | £45,543 |
Top 5 lowest-paying local authorities:
| Local Authority | Annual Median |
|---|---|
| Gwynedd | £25,179 |
| Nottingham | £26,512 |
| West Devon | £26,556 |
| Melton | £26,633 |
| East Lindsey | £26,705 |
London and its commuter belt lead because of the concentration of finance, tech, and professional services jobs — and employers there have to pay more to compete for talent in an expensive city. Rural and coastal areas, by contrast, lean more on tourism, hospitality, and seasonal work, which typically pays less.
Average UK Salary by Gender
Men earn a median of £38,466 a year, compared with £27,850 for women — a 28% difference across all employees.
This isn’t the same as the “gender pay gap” you might see quoted in the news. That figure compares hourly pay for similar full-time work; the 28% gap above is the overall difference across everyone, including the fact that more women work part-time.
The gap varies a lot by region:
| Region | Men | Women | Difference |
|---|---|---|---|
| London | £43,695 | £36,142 | −17% |
| South East | £41,801 | £29,186 | −30% |
| North East | £34,447 | £25,641 | −26% |
It also varies enormously by job. Some roles — housing officers, train drivers, youth workers — show almost no gap. Others, particularly senior management and specialist technical roles, show much wider ones.
Average UK Salary by Occupation and Industry
Job title matters more than almost anything else. The highest-paid role in the UK is aircraft pilots and air traffic controllers, with a median salary of £107,712.
Highest-paying jobs
| Occupation | Annual Median |
|---|---|
| Aircraft pilots & air traffic controllers | £107,712 |
| Transport associate professionals | £93,538 |
| IT directors | £90,081 |
| Marketing, sales & advertising directors | £90,000 |
| Chief executives & senior officials | £89,835 |
| Specialist medical practitioners | £88,997 |
Lowest-paying jobs
| Occupation | Annual Median |
|---|---|
| Bar staff | £9,166 |
| Waiters and waitresses | £10,000 |
| Kitchen and catering assistants | £11,840 |
| Cleaners and domestics | £11,852 |
| Coffee shop workers | £12,170 |
The pattern is consistent: pay rises with training time, qualifications required, and how much risk or responsibility the role carries. A pilot’s salary reflects years of training and the fact that hundreds of lives depend on their judgement each flight. A senior director’s pay reflects the scale of decisions they’re accountable for. At the other end, roles with low barriers to entry and high job availability — bar work, catering, cleaning — tend to sit well below the national median.
What Does the Average Salary Look Like After Tax?
Gross figures only tell half the story. On the median full-time salary of £39,039, you’d typically take home around £2,570 a month after tax and National Insurance — roughly £30,850 a year, though your actual figure depends on your tax code, pension contributions, and student loan repayments if you have them.
Here’s a rough guide for three key figures (2026/27 tax year, standard tax code, no other deductions):
| Gross Annual Salary | Approx. Take-Home (Monthly) | Approx. Take-Home (Annual) |
|---|---|---|
| £32,890 (all-employee median) | ~£2,220 | ~£26,650 |
| £39,039 (full-time median) | ~£2,570 | ~£30,850 |
| £39,778 (London median) | ~£2,610 | ~£31,320 |
These are estimates, not exact figures — always check a current take-home pay calculator with your own tax code and pension rate before making decisions based on this.
How UK Salaries Have Changed Over Time
UK salaries have risen steadily over the past 25 years, but not at a steady pace. Growth was strong in the early 2000s, stalled for years after the 2008 financial crisis, and has accelerated again since around 2015.
The most recent years have seen faster growth, driven by post-Brexit labour shortages, rising demand for skilled workers, and inflation pushing wages up across most sectors. Even so, it’s worth checking real wage growth (pay adjusted for inflation), not just the headline £ figure — a bigger number doesn’t always mean more buying power.
What About the Self-Employed and Part-Time Workers?

The figures above don’t include self-employed workers at all. The ONS survey behind this data (ASHE) is built from PAYE payroll records, so if you work for yourself, none of these numbers directly reflect your income.
Part-time employees are included, and their median pay is £14,713 a year — much lower than full-time pay, mostly because it reflects fewer hours worked, not necessarily a lower hourly rate.
What Counts as a "Good" Salary in the UK Right Now?
A “good” salary depends entirely on your age, location, and job — there’s no single number. But as a rough guide: earning above the median for your age group and region generally puts you ahead of most of your peers.
- In your 20s, £30,000+ puts you ahead of the median for that age group.
- In your 30s and 40s, £40,000+ is solidly above average.
- In London, you’d typically need £40,000+ just to match the local median — the same salary goes further in most other regions.
- Nationally, the top 10% of earners make £69,381 or more.
The most useful comparison isn’t the national figure — it’s the median for your specific age, region, and occupation. Someone earning £35,000 in Sunderland is in a very different position than someone earning £35,000 in London, even though the number looks identical.
Sources & Methodology
All figures in this article come from the Office for National Statistics (ONS) Annual Survey of Hours and Earnings (ASHE), published 23 October 2025, unless otherwise stated.
ASHE is based on a 1% sample of UK jobs drawn from HMRC PAYE records. It covers employee jobs only — it does not include self-employed workers, and it excludes anyone whose pay was affected by absence during the survey period. Annual figures relate to people who’ve been in the same job for at least 12 months.
Because it’s based on employee records rather than a self-reported survey, ASHE is one of the most reliable sources of UK salary data available — but like any dataset, it has limits worth knowing about before you compare your own income to it.
Final Thought
The “average UK salary” is a useful starting point, but it’s really just one number standing in for a huge range of realities. Your age, your region, and your job will always tell you more about where you stand than the national headline figure ever can. Use the breakdowns above to find the comparison that actually applies to you.
Curious how your skills and qualifications affect your earning potential? Explore our range of courses to see how upskilling could move you up the pay scale.
Frequently Asked Questions (FAQ)
What is the average UK salary in 2026?
The median annual salary for all employees is £32,890, based on the latest ONS ASHE data. For full-time workers only, the median rises to £39,039.
What is a good salary in the UK?
It depends on your age and location, but earning above the median for your age bracket and region is a reasonable benchmark. £40,000+ is generally considered strong outside London; inside London, you’d typically want more to match the local cost of living.
What is the average salary after tax in the UK?
On the full-time median of £39,039, take-home pay is typically around £2,570 a month, or roughly £30,850 a year, after tax and National Insurance — though this varies with your tax code and pension contributions.
What is the top 10% salary in the UK?
The top 10% of earners make £69,381 a year or more. This threshold rises sharply in specialist and senior roles.
How much do you need to earn to be in the top 1%?
Top 1% earners in the UK typically need a salary well above £150,000, though this varies by year and is usually concentrated in senior finance, law, and executive roles.
Is the average salary rising faster than inflation?
Recent wage growth has generally outpaced inflation, meaning real (inflation-adjusted) pay has been rising — but this varies by year and sector, so it’s worth checking the latest figures rather than assuming it holds every year.

Robert Lawrence
Author | Specialises in e-learning.
Robert Lawrence is an e-learning specialist and author at Training Express, with over 5 years of experience creating practical resources and strategies to support learners and enhance their professional & personal development.
Related Blogs