Food Hygiene
 Health & Safety
 Safeguarding
 First Aid
 Business Skills
 Personal Development


Course Curriculum
| Certification in Tableau and Data Visualization | |||
| Module 1: Introduction and Study Plan | 00:06:00 | ||
| Module 2: Introduction to Tableau | 00:07:00 | ||
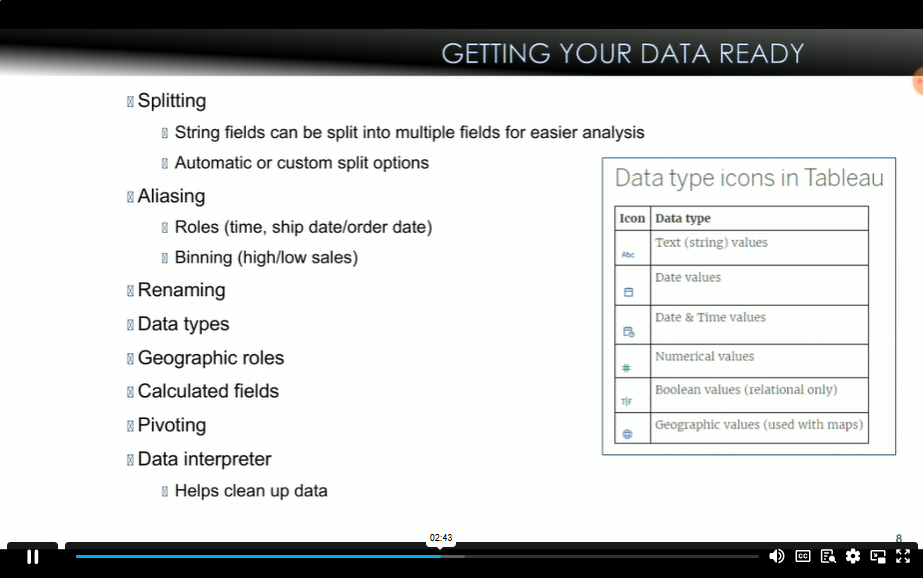
| Module 3: GETTING Your Data Ready | 00:03:00 | ||
| Module 4: Continuation of Getting Your Data Ready | 00:04:00 | ||
| Module 5: Step to Data Formatting | 00:04:00 | ||
| Module 6: Continuation of Step to Data Formatting | 00:05:00 | ||
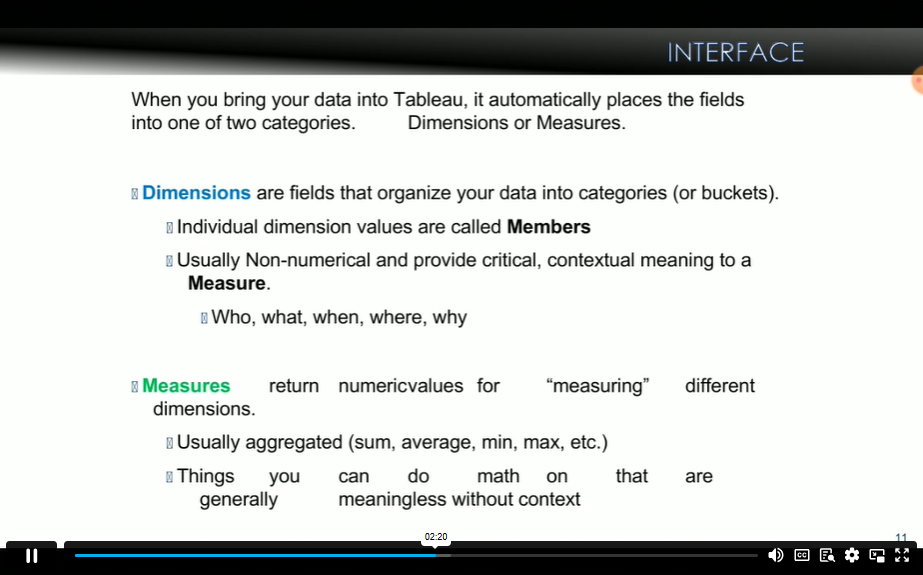
| Module 7: The Interface | 00:05:00 | ||
| Module 8: Continuation of the Interface | 00:04:00 | ||
| Module 9: Continuation of the Interface | 00:04:00 | ||
| Module 10: Continuation of the Interface | 00:04:00 | ||
| Module 11: Continuation of the Interface | 00:03:00 | ||
| Module 12: Continuation of interface | 00:03:00 | ||
| Module 13: Continuation of interface | 00:03:00 | ||
| Module 14: Continuation of Interface | 00:04:00 | ||
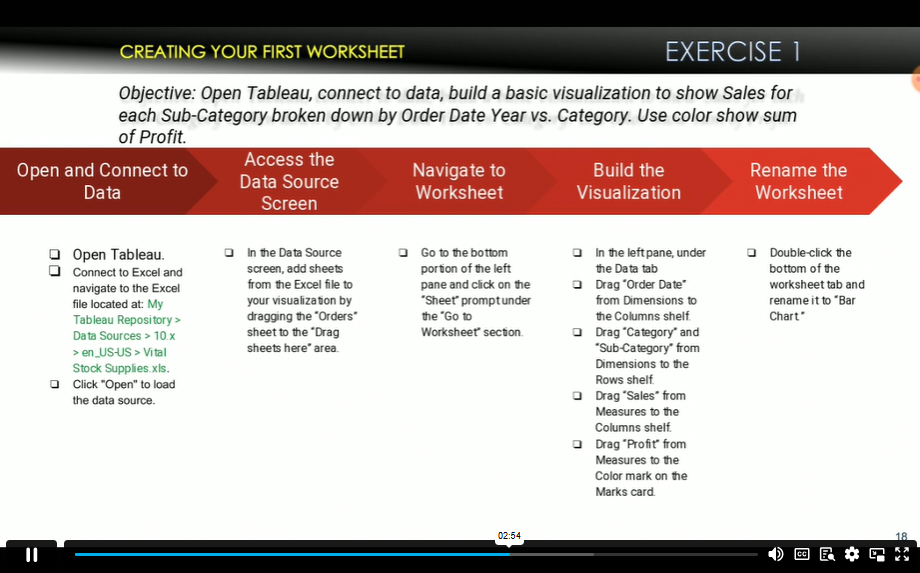
| Module 15: Exercise 1 Creating your First worksheet | 00:05:00 | ||
| Module 16: outcome | 00:03:00 | ||
| Module 17: Bonus Automatic Views | 00:05:00 | ||
| Module 18: Sorting & Filtering | 00:06:00 | ||
| Module 19: Continuation of Sorting and Filtering | 00:02:00 | ||
| Module 20: Filtering Data | 00:05:00 | ||
| Module 21: Apply Filters to Multiple Worksheets | 00:05:00 | ||
| Module 22: Enhancing Results with shorting & Filtering | 00:10:00 | ||
| Module 23: outcome | 00:04:00 | ||
| Module 24: Formatting | 00:07:00 | ||
| Module 25: Highlighters | 00:03:00 | ||
| Module 26: Exercise 3 Line Charts & Highlighters | 00:07:00 | ||
| Module 27: Continuation of Exercise 3 | 00:03:00 | ||
| Module 28: Outcome | 00:02:00 | ||
| Module 29: Continuation of Formatting | 00:04:00 | ||
| Module 30: The Marks Card | 00:04:00 | ||
| Module 31: Continuation of The Marks Card | 00:05:00 | ||
| Module 32: Working with Visualization Scatter Plots | 00:04:00 | ||
| Module 33: Bonus Duplicate as Crosstab | 00:04:00 | ||
| Module 34: Basic Calculations | 00:04:00 | ||
| Module 35: Aggregating Data | 00:07:00 | ||
| Module 36: Continuation of Aggregating Data | 00:03:00 | ||
| Module 37: Granularity of Data | 00:03:00 | ||
| Module 38: Quick Table Calculations | 00:05:00 | ||
| Module 39: Calculated Fields | 00:05:00 | ||
| Module 40: Formulas Makeup Calculated Fields | 00:03:00 | ||
| Module 41: Function | 00:06:00 | ||
| Module 42: Creating a calculated Field | 00:05:00 | ||
| Module 43: Continuation of Creating a calculated Field | 00:06:00 | ||
| Module 44: Outcome | 00:04:00 | ||
| Module 45: Basic Calculations | 00:09:00 | ||
| Module 46: Spotlighting a Report | 00:10:00 | ||
| Module 47: outcome | 00:04:00 | ||
| Module 48: Bonus Exercise Tips & Tricks | 00:10:00 | ||
| Module 49: Bonus Exercise | 00:07:00 | ||
| Module 50: Bar Plot | 00:07:00 | ||
| Module 51: Bar Plot Exercise 7 Stack bar chart | 00:08:00 | ||
| Module 52: Outcome | 00:03:00 | ||
| Module 53: Heat Maps | 00:04:00 | ||
| Module 54: Exercise 8 Heat Map | 00:07:00 | ||
| Module 55: Exercise 8 Outcome | 00:03:00 | ||
| Module 56: Scatter Plots | 00:05:00 | ||
| Module 57: Exercise 9 Scatter Plot | 00:07:00 | ||
| Module 58: Exercise 9 Outcome | 00:03:00 | ||
| Module 59: Pie Chart | 00:03:00 | ||
| Module 60: Exercise 10 Pie with Multiple Marks | 00:10:00 | ||
| Module 61: Box Plot | 00:04:00 | ||
| Module 62: Exercise 11 Box Plot | 00:08:00 | ||
| Module 63: Outcome Box Plot | 00:02:00 | ||
| Module 64: Tree Maps | 00:05:00 | ||
| Module 65: Exercise 12 Show Tree Maps | 00:05:00 | ||
| Module 66: Outcome Tree Maps | 00:03:00 | ||
| Module 67: Area Charts | 00:04:00 | ||
| Module 68: Exercise 13 Area Chart | 00:07:00 | ||
| Module 69: Outcome | 00:03:00 | ||
| Module 70: Exercise 14 Maps | 00:09:00 | ||
| Module 71: Exercise 14 Outcome | 00:04:00 | ||
| Module 72: Dashboard | 00:09:00 | ||
| Module 73: Adding Dashboard Objects | 00:04:00 | ||
| Module 74: Organizing Dashboards | 00:04:00 | ||
| Module 75: Continuation of organizing Dashboard | 00:04:00 | ||
| Module 76: Create a Dashboard Exercise 15 | 00:11:00 | ||
| Module 77: Publishing and Sharing | 00:11:00 | ||
| Module 78: Other Session and Next Step | 00:05:00 | ||
| Module 79: Tableau General Overview simple Example | 00:04:00 | ||
| Module 80: Tableau General Overview Calculated Fields | 00:05:00 | ||
| Module 81: Tableau General Overview Bringing it all Together | 00:03:00 | ||
| Module 82: Use for Reporting Examples | 00:05:00 | ||
| Module 83: Tableau Reporting Example | 00:04:00 | ||
| Module 84: Use for Storytelling Examples | 00:06:00 | ||
| Module 85: Tableau – Storytelling Example (K-MAX) | 00:05:00 | ||
| Module 86: Advanced Features – Examples | 00:04:00 | ||
| Module 87: Continuation of Advance Features – Connection Tableau to R | 00:04:00 | ||
| Module 88: Step to connect | 00:06:00 | ||
| Module 89: Advanced FeaModule 88.: Step to connect tures Example | 00:04:00 | ||
| Module 90: Assignment | 00:02:00 | ||
£20
ex Vat
TAKE THIS COURSE
SAVE 84% - OFFER ENDS SOON
- Original price was: £125.00.£20.00Current price is: £20.00. ex Vat
- 1 year
- Intermediate
- Course Certificate
- 7 hours, 32 minutes Gift this course
Buying more than one of the same courses?
- 50% discount for orders of 10+ courses
- 60% discount for orders of 50+ courses
- 70% discount for orders of 100+ courses
Looking for a more personalised package?
contact us nowInstructors
8 STUDENTS ENROLLED